
AI Chart Animation: Turn Static Charts Into Data Videos
How I turn static charts into animated data videos with Gemini Omni 1.2 Flash. The first and last frame method that works, and the shortcut that fails.

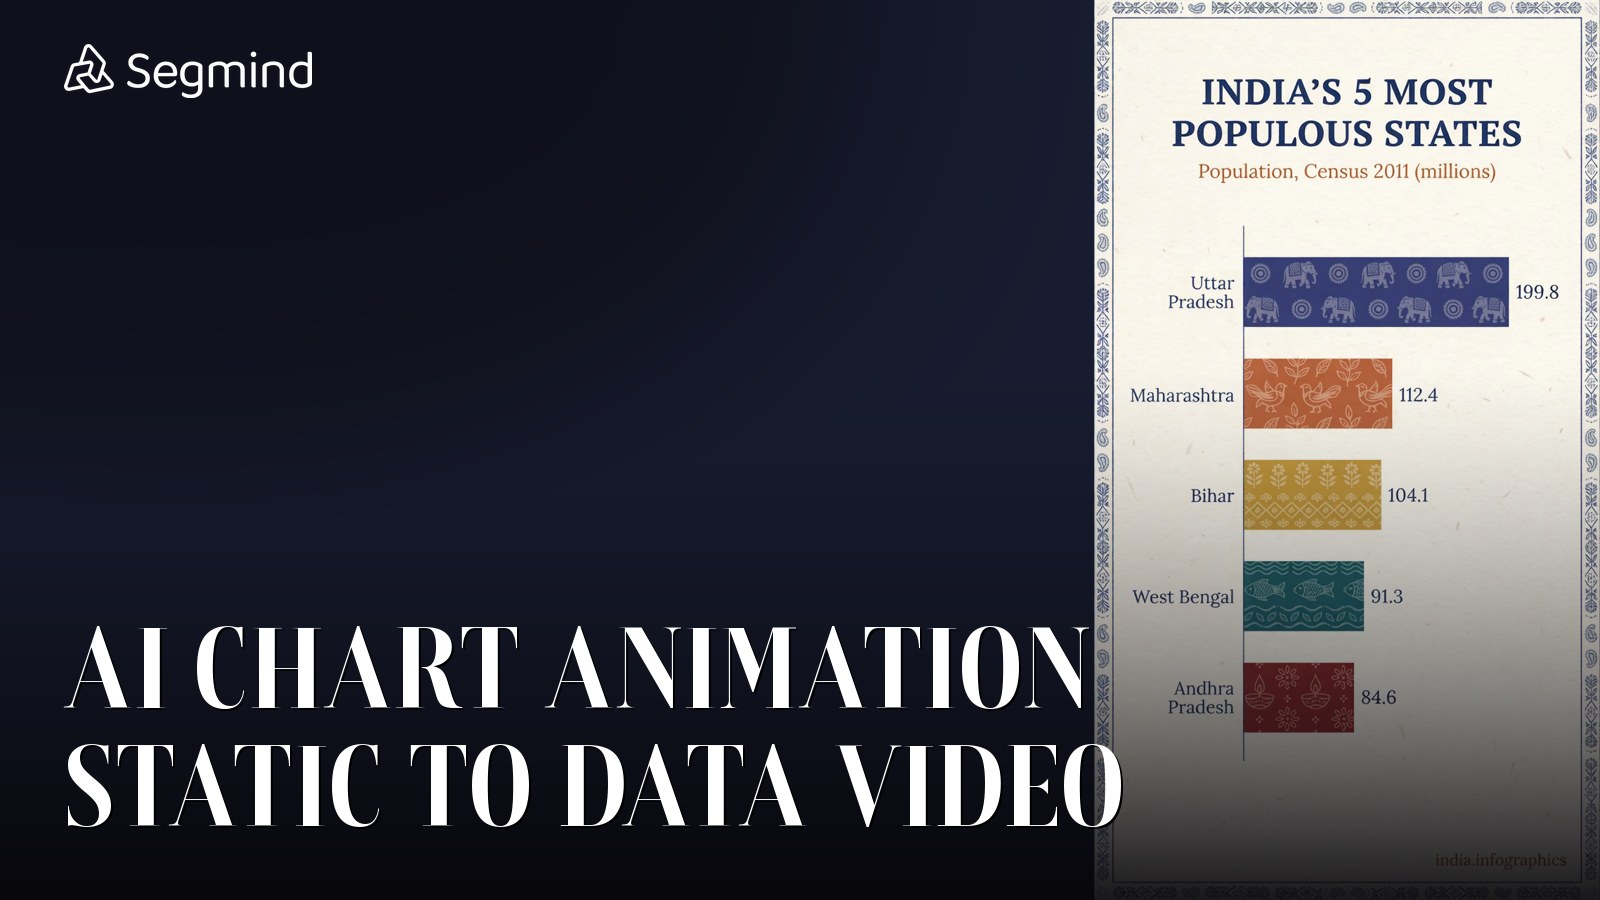
I am building a data-video channel, so this was the test I cared about most. AI chart tools are one of the most searched AI categories in India right now, but a static chart does not stop the scroll. An animated one does. The question was simple: can a video model animate a chart without getting the numbers wrong?
With Google's Gemini Omni 1.2 Flash on Segmind, the answer is yes, but only one way. I ran it two ways. One was nearly perfect. The other failed on accuracy. Here is both, and the recipe I now use.
- Full review: Gemini Omni 1.2 Flash tested
- AI animation and motion graphics explainers (coming 9 Nov)
- AI chart animation for data videos (you are here)
- Hindi AI video: Diwali greetings and translation (coming 6 Nov)
- AI video editing on real UGC footage (coming 7 Nov)
- AI product videos from one packshot (coming 8 Nov)
The method that works: first frame plus last frame
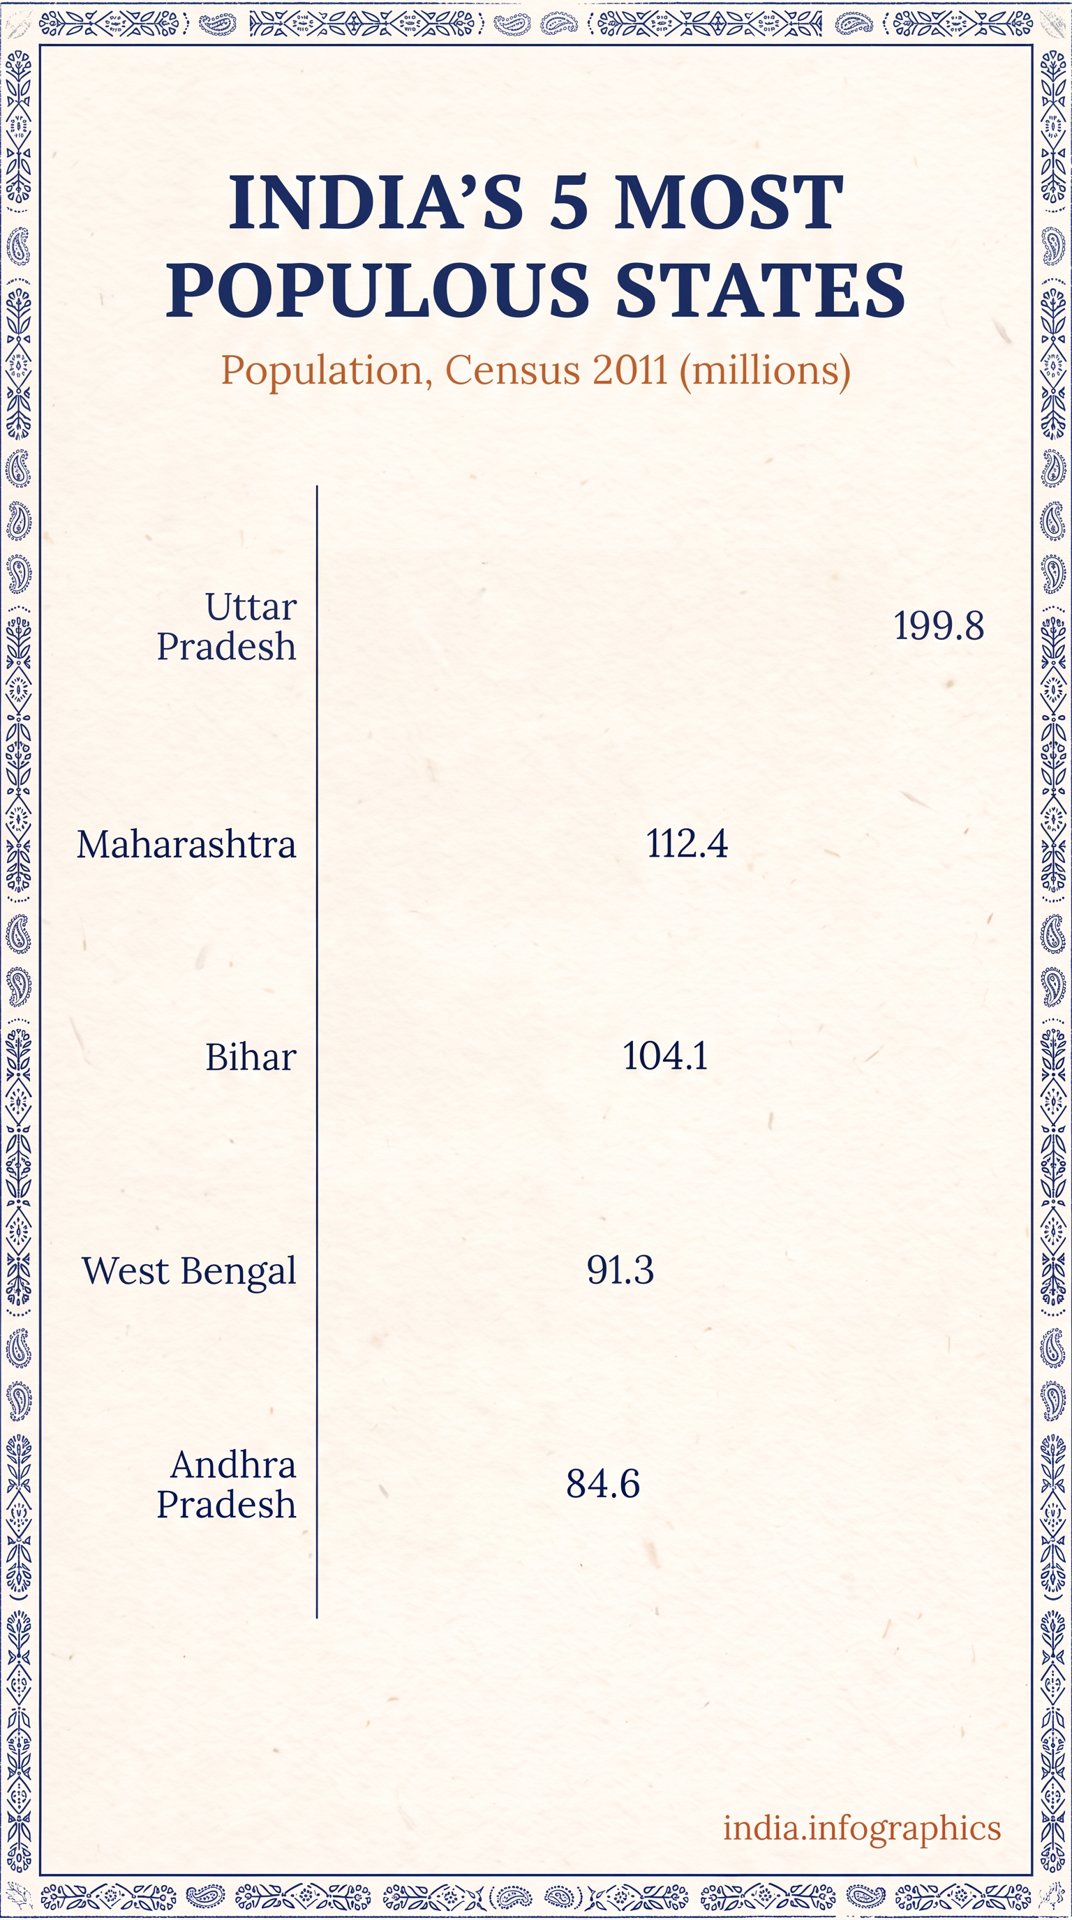
I rendered a finished bar chart with Nano Banana Pro, then edited it to remove the bars. I passed the empty chart as the first frame and the finished chart as the last frame.
First frame
first_frame_image
Last frame
last_frame_image
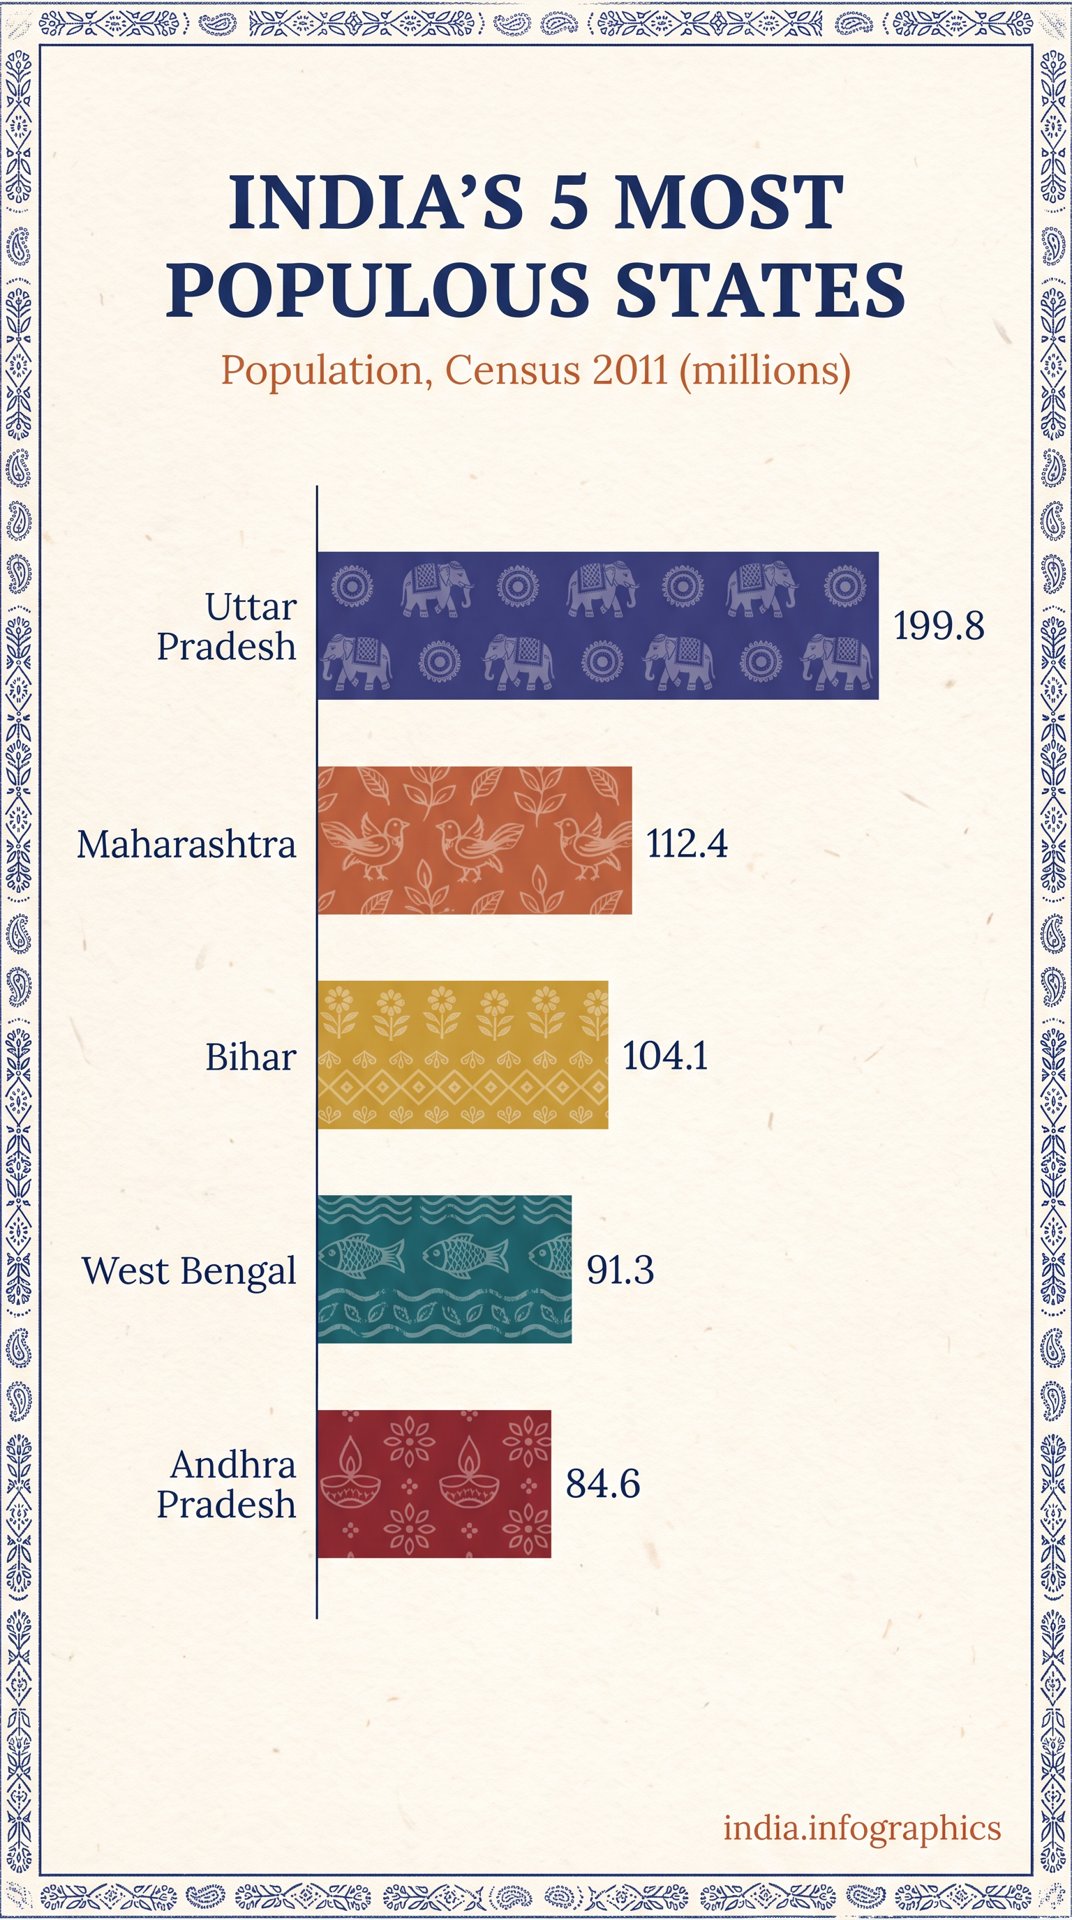
Both frames made with Nano Banana Pro. Census 2011 population figures.
ParametersAPI: image-to-video | aspect_ratio: 9:16 | resolution: 720p | duration: 8 | first + last frame | seed: 7705 | cost: $0.60 | time: 53 s
Gemini Omni 1.2 Flash AI chart animation: bars grow in order and land exactly on the supplied last frame.
The layout stayed locked, every word and number held steady, the bars grew in order with a tabla hit on each, and it landed exactly on my last frame. That is a publishable Reel for 60 cents. One thing to watch: the image model kept the numbers on my "empty" start frame, so check your frames before you animate.
The method that fails: numbers in the prompt
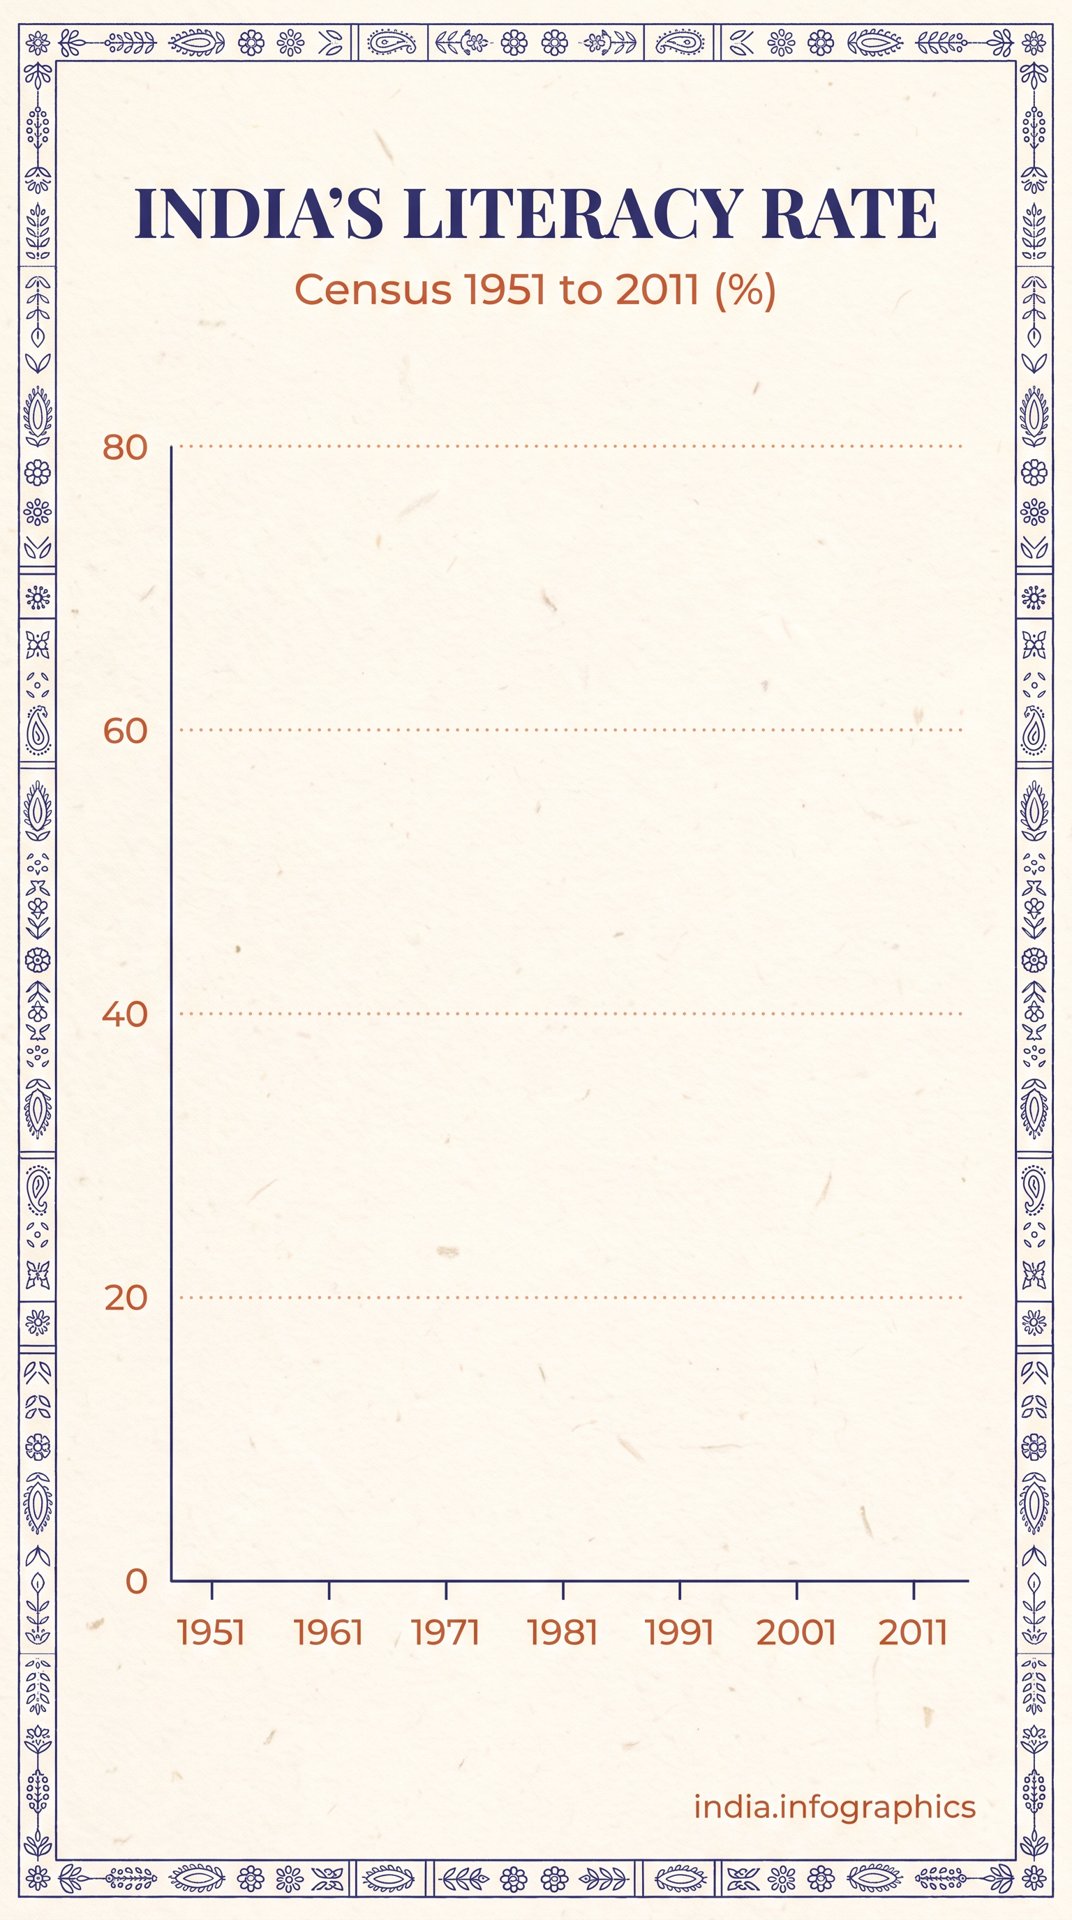
Then I tried the shortcut. I gave Omni only an empty line chart and put the literacy values in the prompt, asking it to plot seven points on a 0 to 80 scale.
Input
first_frame_image only
Output
no last frame
18.3 drawn near 33, 74.0 drawn near 57, points off their years, two labels lost. Cost $0.90.
ParametersAPI: image-to-video | aspect_ratio: 9:16 | resolution: 720p | duration: 12 | first frame only | seed: 7805 | cost: $0.90 | time: 67 s
The layout and axes stayed locked and the line drew left to right, but the points landed at the wrong heights and two labels vanished. Omni cannot plot data. It animates toward a finished chart with great precision, but it does not do the maths.
My recipe for animated data posts
- Step 1: render the finished chart with an image model (title, labels, values, bars). This is where accuracy lives.
- Step 2: edit it to remove the bars or line, keeping everything else pixel-identical. Check the result: it may keep the numbers.
- Step 3: run image-to-video with both frames, 8 to 10 seconds. Say "locked-off camera", list everything that never moves, describe the reveal order, and end with "the final frame matches the completed chart exactly".
- Step 4: add one sound cue per bar or point. Audio is free and it makes the reveal land.
Remember the limit: with a last frame set, duration is 3 to 10 seconds.
The code
import requests

r = requests.post(
    "https://api.segmind.com/v1/gemini-omni-1.2-flash-image-to-video",
    headers={"x-api-key": "YOUR_SEGMIND_API_KEY"},
    json={
        "prompt": "Locked-off camera... everything except the bars stays perfectly still... "
                  "bars grow one at a time, top to bottom... "
                  "the final frame matches the completed chart exactly.",
        "first_frame_image": "https://your-cdn.com/chart-empty.png",
        "last_frame_image": "https://your-cdn.com/chart-final.png",
        "aspect_ratio": "9:16",
        "resolution": "720p",
        "duration": 8,            # 3 to 10 s when a last frame is set
    },
)
r.raise_for_status()
open("chart.mp4", "wb").write(r.content)
Full parameters are on the Gemini Omni 1.2 Flash image-to-video page.
FAQ
Can AI animate a chart accurately?
Yes, if you supply the finished chart as the last frame. Gemini Omni 1.2 Flash landed exactly on it. Without a last frame, it put data points at the wrong heights.
What is the best way to make an animated bar chart with AI?
Render the finished chart, render a stripped version, then animate between them with first and last frames. It cost me $0.60 for 8 seconds at 720p.
Can Gemini Omni plot numbers from a prompt?
No. In my test it drew 18.3 near 33 and 74.0 near 57. Do the plotting in an image or charting tool first.
What aspect ratio should I use for data Reels?
9:16 for Instagram Reels and YouTube Shorts. Omni supports 16:9 and 9:16 at the same price.
Try Gemini Omni 1.2 Flash on Segmind and turn your next static chart into a data video.
Test notes: all tests ran on 05 Nov 2026 on Segmind. KAAPI THEORY and the generated people are fictional. Real footage is free-licence stock from Mixkit. Input images were made with Nano Banana Pro. Every Omni output carries SynthID and C2PA.